K means Clustering

K-means Clustering

k-means 算法源于信号处理中的一种矢量量化方法,现在则更多地作为一种聚类分析方法流行于数据挖掘领域。k-means 聚类的目的是:把 n 个点(可以是样本的一次观察或一个实例)划分到 k 个聚类中,使得每个点都属于离他最近的均值(此即聚类中心)对应的聚类,以之作为聚类的标准。详细介绍可以查看维基百科的解释

核心算法

已知观测集\((x_{1},x_{2},...,x_{n})\),其中每个观测都是一个 d-维实矢量,k-means 聚类要把这 n 个观测划分到 k 个集合中(k≤n),使得组内平方和最小。换句话说,它的目标是找到使得满足下式 \[\arg\min_S \sum_{i=1}^{k}{ \sum_{x\in S_i}{\|x_i - \mu_i \|^2} }\]

其中\(\mu_i\)\(S_i\)中所有点的平均值

算法流程描述

下面用伪代码来描述下算法的具体过程

  • 初始化 均值 \(m_1, m_2, \ldots , m_k\)
  • until 均值不再改变
    • 使用估计的均值根据距离最近的原则把各个样本分到相应的聚类当中
    • For i from 1 to k
      • 用聚类\(i\)中所有样本的均值来代替\(m_i\)
    • end_for
  • end_until

代码实现

下面看看 k-mean 算法具体是如何实现的,下面这段代码是生成数据的。

1
2
3
4
5
6
7
8
9
10
11
12
13
14
15
import numpy as np
import matplotlib.pyplot as plt

X = np.random.rand(100, 2)
X_mean = 8 + (4 * np.random.rand(4, 2)) # N(8,4)
which = np.random.choice(np.array([0,1,2,3]), size=100, replace=True)
for i in range(0, X.shape[0]):
X[i] = X[i] + X_mean[which[i], :]

# Plot the points
fig, ax = plt.subplots()
ax.scatter(X[which == 0][:, 0], X[which == 0][:, 1], c='blue')
ax.scatter(X[which == 1][:, 0], X[which == 1][:, 1], c='green')
ax.scatter(X[which == 2][:, 0], X[which == 2][:, 1], c='red')
ax.scatter(X[which == 3][:, 0], X[which == 3][:, 1], c='cyan')

生成的数据如下图

数据

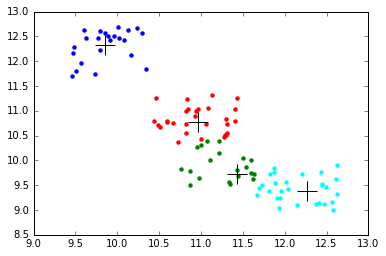
接下来的这段代码是 K 均值的核心部分

1
2
3
4
5
6
7
8
9
10
11
12
13
14
15
16
17
18
19
20
21
22
23
24
from sklearn.cluster import KMeans

kmeans = KMeans(n_clusters=4, n_init=15)
kmeans.fit(X)
ypred = kmeans.predict(X)

# Print confusion matrix. Note that the matrix is not aligned because we don't know
# the correspondence between the assigned cluster and the generated cluster, but the
# matrix should show one high value per row and/or column.
confusion_matrix = np.zeros((4, 4))
for i in range(0, which.shape[0]):
actual = which[i]
predicted = ypred[i]
confusion_matrix[actual, predicted] = confusion_matrix[actual, predicted] + 1
print confusion_matrix

# Plot points with cluster centers (marked with +)
fig, ax = plt.subplots()
ax.scatter(X[which == 0][:, 0], X[which == 0][:, 1], c='blue')
ax.scatter(X[which == 1][:, 0], X[which == 1][:, 1], c='green')
ax.scatter(X[which == 2][:, 0], X[which == 2][:, 1], c='red')
ax.scatter(X[which == 3][:, 0], X[which == 3][:, 1], c='cyan')
for cc in kmeans.cluster_centers_:
ax.plot(cc[0], cc[1], marker='+', color='black', markersize=20)
分类

当前网速较慢或者你使用的浏览器不支持博客特定功能,请尝试刷新或换用Chrome、Firefox等现代浏览器